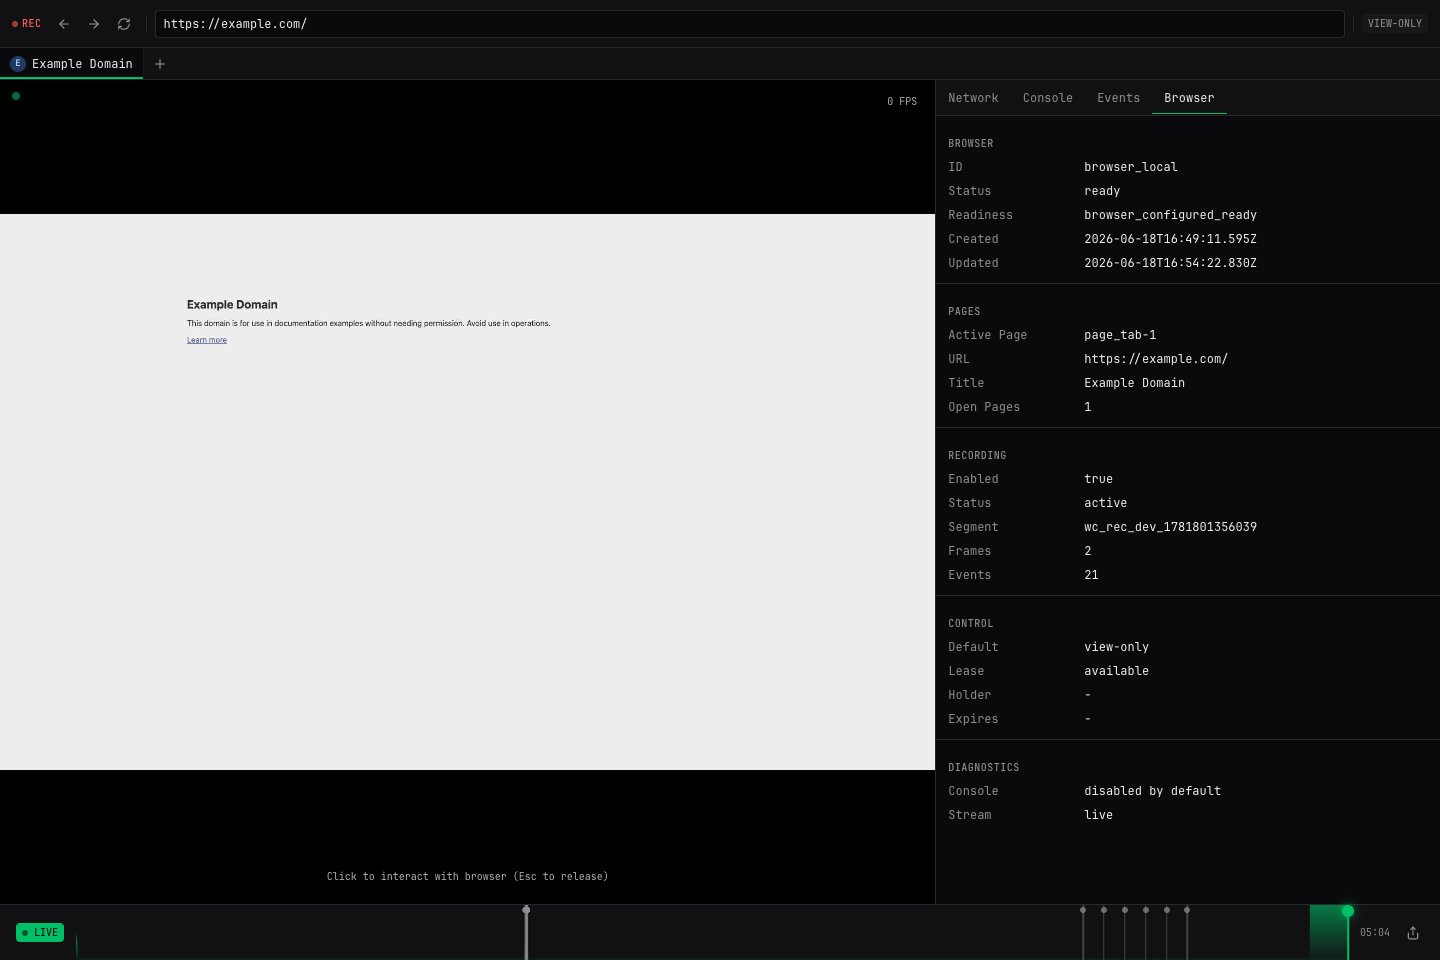
Debug UI anatomy
| Area | What it answers |
|---|---|
| Live browser viewport | What page is the browser actually showing now? |
| Active page metadata | Which URL, title, and page ID is Webcompute operating on? |
| Runtime readiness | Is the browser ready, configuring, recovering, stopped, or blocked? |
| Recording state | Is replay evidence being captured for later review? |
| Event timeline | What navigation, action, download, dialog, blocker, or error happened over time? |
| Inspector panels | Which status, artifacts, downloads, dialogs, pages, or capabilities can you inspect next? |
What you can inspect
Live browser sessions
Open a live Debug UI when you need to see the current page.
Recordings
Replay what happened after the run.
Artifacts and downloads
Capture files, reports, PDFs, and evidence.
Status, events, and logs
Connect browser state and timeline evidence to application logs.
Blockers and CAPTCHA
Return clear blocker state instead of pretending success.
Typical debug loop
Open evidence
Use Debug UI for live inspection, recordings for replay, and artifacts for downloaded files.
What to keep with the job
Store enough evidence to explain the outcome without leaking credentials:- Job ID and browser ID.
- Result status.
- Final page URL and title.
- Bounded observation metadata.
- Artifact, download, file, or recording IDs.
- Redacted error
code,name, andmessage. - Blocker or CAPTCHA state when present.