> ## Documentation Index
> Fetch the complete documentation index at: https://docs-preview.webcompute.dev/llms.txt
> Use this file to discover all available pages before exploring further.
# Observability
> Connect browser status, execution logs, events, recordings, artifacts, and app logs into an inspectable production workflow.
Browser jobs should leave enough evidence to answer three questions:
1. What did the browser do?
2. What did the page show?
3. Why did the job stop, retry, or ask for review?
Webcompute gives you browser status, browser-code execution logs, observations, events, recordings, downloads, generated files, screenshots, and artifact IDs. Your application should connect those signals to its job ID, user request, policy, retry attempts, and final result.
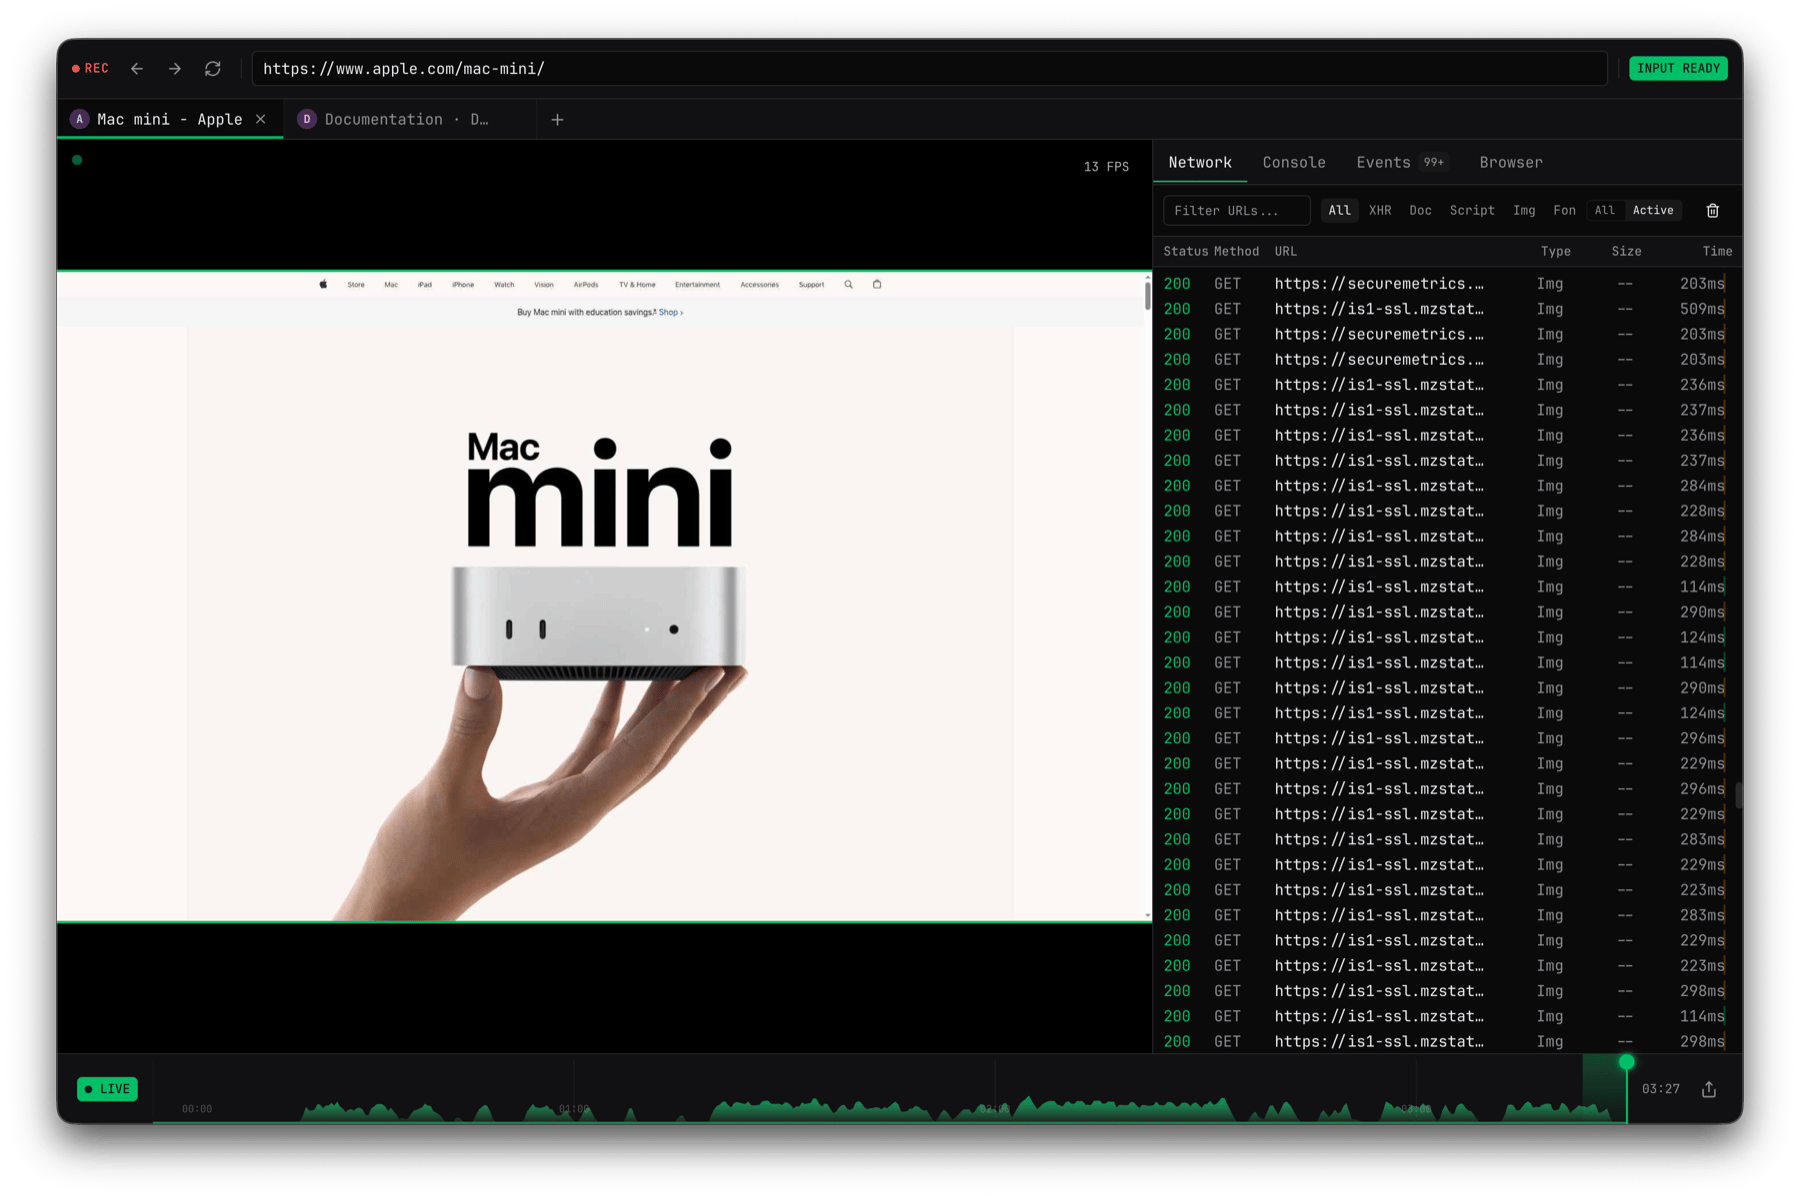 Use Debug UI as the operator surface while a browser job is active. Store durable evidence with the job so operators can replay the run later through recordings, events, artifacts, and downloads.
## What to store
| Signal | Store |
| ------------------ | ------------------------------------------------------------------------------------------------------ |
| Job metadata | Your job ID, target URL, policy summary, timeout, retry count, and user-visible status |
| Browser identity | Browser ID and lifecycle status |
| Execution evidence | Step result, page URL/title, bounded observation summary, and redacted logs |
| Artifacts | Screenshot IDs, recording segment IDs, generated file IDs, download IDs, and replay URLs when returned |
| Errors | Redacted `code`, `name`, and `message`; avoid raw request bodies and signed URLs |
| Review state | Blocker, CAPTCHA, approval, or policy signal that caused the job to stop |
## SDK job log shape
```ts theme={null}
import { redactValueForObservability } from "@webcompute/sdk";
function safeError(error: unknown) {
if (error && typeof error === "object") {
const value = error as { code?: unknown; name?: unknown; message?: unknown };
return redactValueForObservability({
code: value.code,
name: value.name,
message: value.message,
});
}
return { message: redactValueForObservability(String(error)) };
}
const result = await browser.playwright.execute({
code: `
await page.goto("https://example.com");
return { title: await page.title(), url: page.url() };
`,
capture: { status: true, observation: { kind: "aria", includeOn: "always" } },
});
await logBrowserStep({
jobId,
browserId: browser.id,
success: result.success,
page: result.page,
status: result.status,
observation: result.observation
? {
kind: result.observation.kind,
chars: result.observation.chars,
truncated: result.observation.truncated,
}
: undefined,
artifacts: result.artifacts,
error: result.error ? safeError(result.error) : undefined,
});
```
Do not store full observations by default. Store summaries and artifact IDs, then fetch deeper evidence only when an operator needs it.
## Events and recordings
Use events for timelines and recordings for visual review. Recording is opt-in at browser creation.
```ts theme={null}
const browser = await web.browser.create({ recording: true });
const events = await browser.events({ limit: 50 });
const recording = await browser.recordings.get();
const segments = await browser.recordings.segments({ limit: 10 });
```
Debug UI can replay recording segments when recording was enabled. The replay view keeps captured page frames, timeline position, browser metadata, and inspector panels together so reviewers can understand what happened without rerunning the workflow.
Use Debug UI as the operator surface while a browser job is active. Store durable evidence with the job so operators can replay the run later through recordings, events, artifacts, and downloads.
## What to store
| Signal | Store |
| ------------------ | ------------------------------------------------------------------------------------------------------ |
| Job metadata | Your job ID, target URL, policy summary, timeout, retry count, and user-visible status |
| Browser identity | Browser ID and lifecycle status |
| Execution evidence | Step result, page URL/title, bounded observation summary, and redacted logs |
| Artifacts | Screenshot IDs, recording segment IDs, generated file IDs, download IDs, and replay URLs when returned |
| Errors | Redacted `code`, `name`, and `message`; avoid raw request bodies and signed URLs |
| Review state | Blocker, CAPTCHA, approval, or policy signal that caused the job to stop |
## SDK job log shape
```ts theme={null}
import { redactValueForObservability } from "@webcompute/sdk";
function safeError(error: unknown) {
if (error && typeof error === "object") {
const value = error as { code?: unknown; name?: unknown; message?: unknown };
return redactValueForObservability({
code: value.code,
name: value.name,
message: value.message,
});
}
return { message: redactValueForObservability(String(error)) };
}
const result = await browser.playwright.execute({
code: `
await page.goto("https://example.com");
return { title: await page.title(), url: page.url() };
`,
capture: { status: true, observation: { kind: "aria", includeOn: "always" } },
});
await logBrowserStep({
jobId,
browserId: browser.id,
success: result.success,
page: result.page,
status: result.status,
observation: result.observation
? {
kind: result.observation.kind,
chars: result.observation.chars,
truncated: result.observation.truncated,
}
: undefined,
artifacts: result.artifacts,
error: result.error ? safeError(result.error) : undefined,
});
```
Do not store full observations by default. Store summaries and artifact IDs, then fetch deeper evidence only when an operator needs it.
## Events and recordings
Use events for timelines and recordings for visual review. Recording is opt-in at browser creation.
```ts theme={null}
const browser = await web.browser.create({ recording: true });
const events = await browser.events({ limit: 50 });
const recording = await browser.recordings.get();
const segments = await browser.recordings.segments({ limit: 10 });
```
Debug UI can replay recording segments when recording was enabled. The replay view keeps captured page frames, timeline position, browser metadata, and inspector panels together so reviewers can understand what happened without rerunning the workflow.
 Keep signed Debug UI and CDP URLs out of shared logs. They are bearer capabilities.
## Trace IDs
If your deployment exposes request IDs or trace IDs, store them with your app job record. Otherwise, correlate by your job ID, browser ID, timestamps, event IDs, and artifact IDs.
Reference: [observations](/runtime-concepts/observations), [recordings](/observe-and-debug/recordings), [status, events, and logs](/observe-and-debug/status-events-and-logs), [SDK resources reference](/reference/sdk-resources-reference), and [errors and retries](/production/errors-and-retries).
Keep signed Debug UI and CDP URLs out of shared logs. They are bearer capabilities.
## Trace IDs
If your deployment exposes request IDs or trace IDs, store them with your app job record. Otherwise, correlate by your job ID, browser ID, timestamps, event IDs, and artifact IDs.
Reference: [observations](/runtime-concepts/observations), [recordings](/observe-and-debug/recordings), [status, events, and logs](/observe-and-debug/status-events-and-logs), [SDK resources reference](/reference/sdk-resources-reference), and [errors and retries](/production/errors-and-retries).