> ## Documentation Index
> Fetch the complete documentation index at: https://docs-preview.webcompute.dev/llms.txt
> Use this file to discover all available pages before exploring further.
# Observe and debug
> Inspect browser-agent runs with live sessions, recordings, artifacts, status, events, blockers, and errors.
Browser agents fail in ways text-only agents do not: blocked pages, unexpected dialogs, changed layouts, downloads, redirects, auth walls, and slow pages. Webcompute keeps the run inspectable.
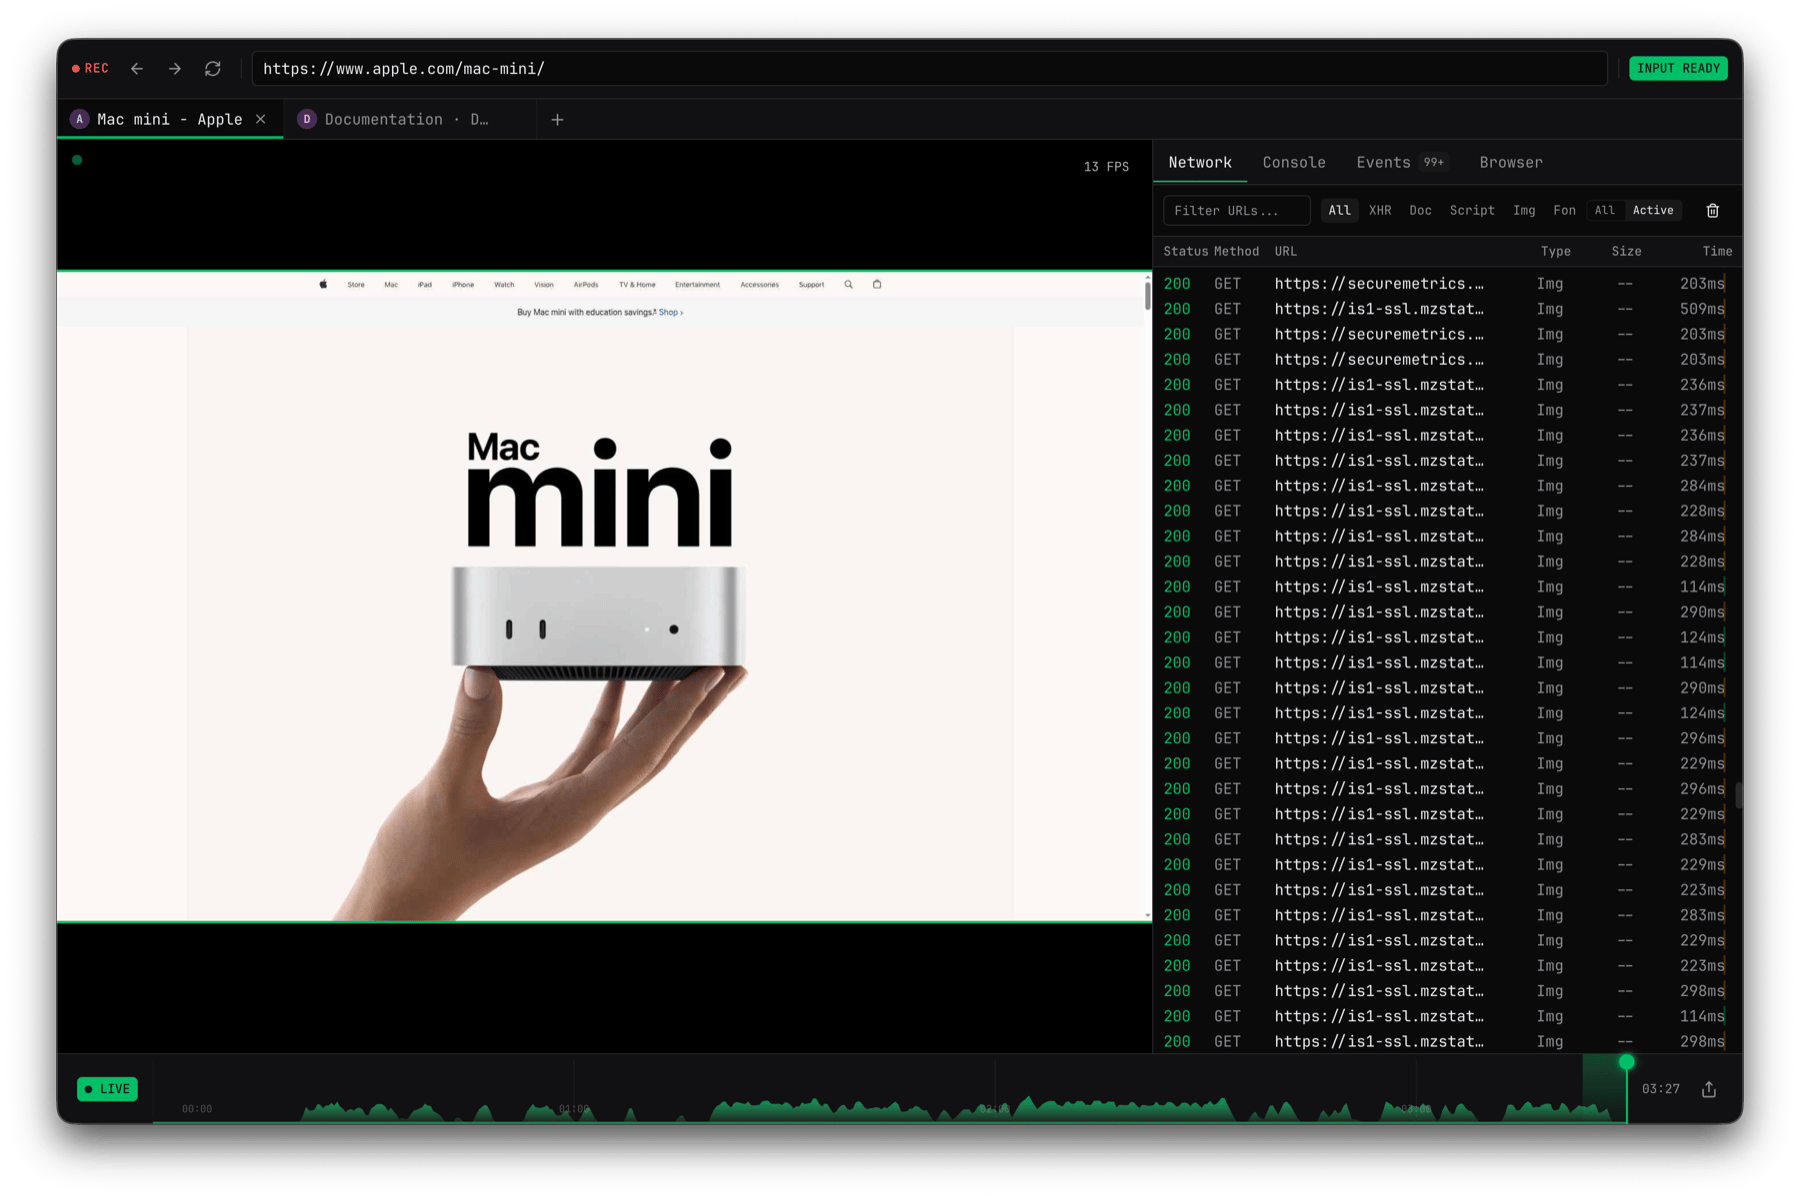 The Debug UI gives operators a live browser view plus browser status, page metadata, recording state, event timeline, inspector panels, and browser-moment sharing. When recording is enabled, the same surface can replay captured browser frames after the run moves on or closes.
## Debug UI anatomy
| Area | What it answers |
| --------------------- | ----------------------------------------------------------------------------------------- |
| Live browser viewport | What page is the browser actually showing now? |
| Active page metadata | Which URL, title, and page ID is Webcompute operating on? |
| Runtime readiness | Is the browser ready, configuring, recovering, stopped, or blocked? |
| Recording state | Is replay evidence being captured for later review? |
| Event timeline | What navigation, action, download, dialog, blocker, or error happened over time? |
| Inspector panels | Which status, artifacts, downloads, dialogs, pages, or capabilities can you inspect next? |
| Share controls | How do you hand this exact browser moment to a teammate, reviewer, or agent? |
Use Debug UI when the live browser state matters. Share a browser moment when another person or agent needs the same page state and timestamp. Use recordings when the run has already moved on or closed. Use artifacts and downloads when the workflow produced files that another system needs to review.
## What you can inspect
Open a live Debug UI and share exact browser moments with humans or agents.
Replay what happened after the run.
Capture files, reports, PDFs, and evidence.
Connect browser state and timeline evidence to application logs.
Return clear blocker state instead of pretending success.
## Typical debug loop
Start with `completed`, `blocked`, `needs_confirmation`, `failed`, or `cancelled`.
Look at page titles, URLs, observations, and errors from the browser steps.
Use Debug UI for live inspection, browser-moment sharing for handoffs, recordings for replay, and artifacts for downloaded files.
Add domain policy, structured output, approvals, timeouts, or deterministic checks where the run was ambiguous.
## What to keep with the job
Store enough evidence to explain the outcome without leaking credentials:
* Job ID and browser ID.
* Result status.
* Final page URL and title.
* Bounded observation metadata.
* Artifact, download, file, or recording IDs.
* Redacted error `code`, `name`, and `message`.
* Blocker or CAPTCHA state when present.
Do not store signed Debug UI URLs, signed CDP URLs, raw provider keys, cookies, or full page observations in shared logs.
Treat signed Debug UI and CDP URLs as bearer credentials.
Reference: [results and evidence](/observe-and-debug/results-and-evidence), [production observability](/production/observability), and [errors](/observe-and-debug/errors).
The Debug UI gives operators a live browser view plus browser status, page metadata, recording state, event timeline, inspector panels, and browser-moment sharing. When recording is enabled, the same surface can replay captured browser frames after the run moves on or closes.
## Debug UI anatomy
| Area | What it answers |
| --------------------- | ----------------------------------------------------------------------------------------- |
| Live browser viewport | What page is the browser actually showing now? |
| Active page metadata | Which URL, title, and page ID is Webcompute operating on? |
| Runtime readiness | Is the browser ready, configuring, recovering, stopped, or blocked? |
| Recording state | Is replay evidence being captured for later review? |
| Event timeline | What navigation, action, download, dialog, blocker, or error happened over time? |
| Inspector panels | Which status, artifacts, downloads, dialogs, pages, or capabilities can you inspect next? |
| Share controls | How do you hand this exact browser moment to a teammate, reviewer, or agent? |
Use Debug UI when the live browser state matters. Share a browser moment when another person or agent needs the same page state and timestamp. Use recordings when the run has already moved on or closed. Use artifacts and downloads when the workflow produced files that another system needs to review.
## What you can inspect
Open a live Debug UI and share exact browser moments with humans or agents.
Replay what happened after the run.
Capture files, reports, PDFs, and evidence.
Connect browser state and timeline evidence to application logs.
Return clear blocker state instead of pretending success.
## Typical debug loop
Start with `completed`, `blocked`, `needs_confirmation`, `failed`, or `cancelled`.
Look at page titles, URLs, observations, and errors from the browser steps.
Use Debug UI for live inspection, browser-moment sharing for handoffs, recordings for replay, and artifacts for downloaded files.
Add domain policy, structured output, approvals, timeouts, or deterministic checks where the run was ambiguous.
## What to keep with the job
Store enough evidence to explain the outcome without leaking credentials:
* Job ID and browser ID.
* Result status.
* Final page URL and title.
* Bounded observation metadata.
* Artifact, download, file, or recording IDs.
* Redacted error `code`, `name`, and `message`.
* Blocker or CAPTCHA state when present.
Do not store signed Debug UI URLs, signed CDP URLs, raw provider keys, cookies, or full page observations in shared logs.
Treat signed Debug UI and CDP URLs as bearer credentials.
Reference: [results and evidence](/observe-and-debug/results-and-evidence), [production observability](/production/observability), and [errors](/observe-and-debug/errors).